What if there was a simple tool to improve the quality of your research?
- Fiona Booth

- Jun 19, 2024
- 4 min read

There is a tool which can help you to design, conduct and report better research.
It’s free, it doesn’t need a username or password and it’s easier to use than you think!
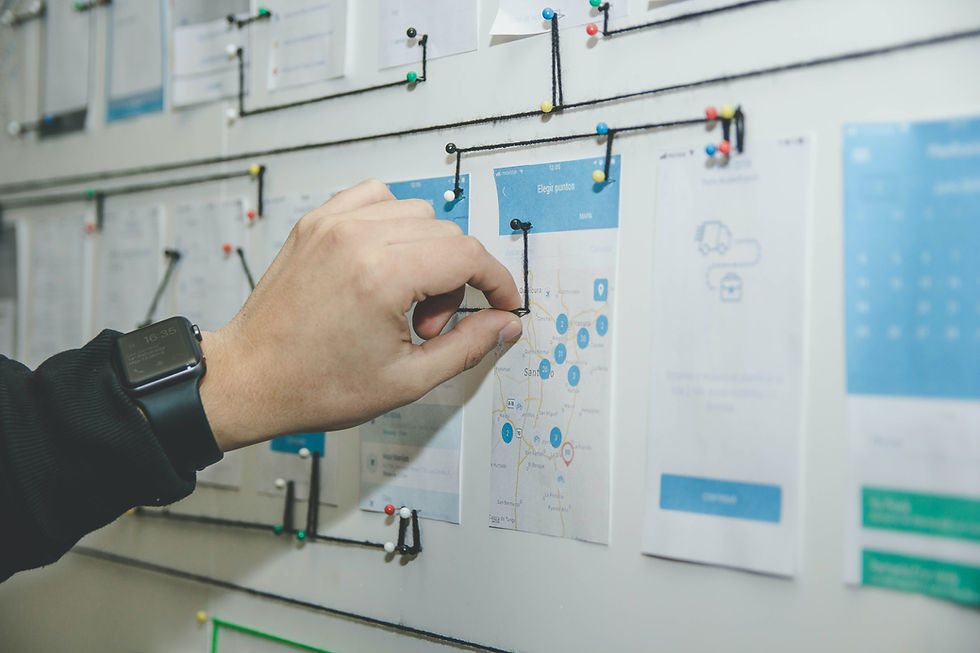
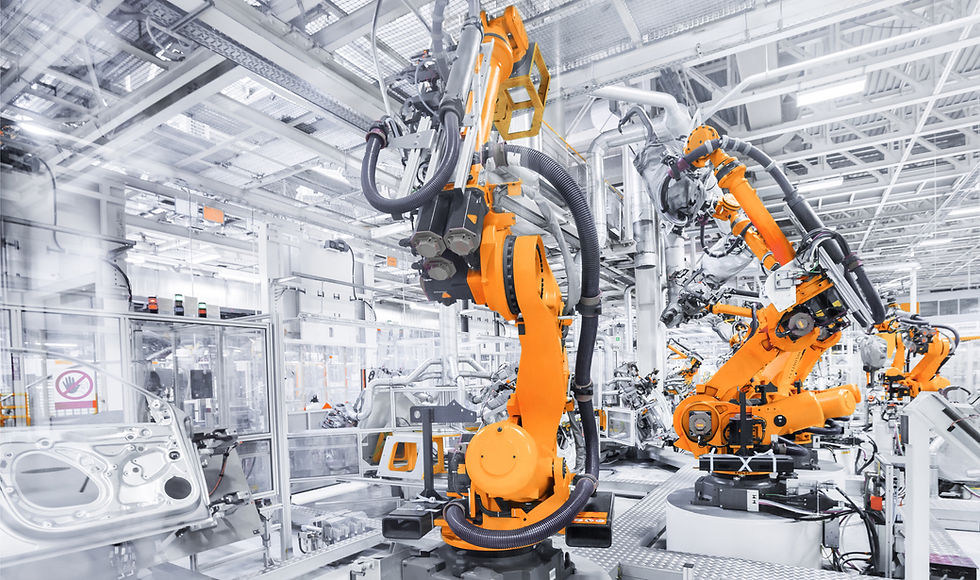
In this blog we will share an easy technique to help you analyse, improve and communicate your research. It’s the simple process map, also known as a flowchart, and it is the cornerstone of quality improvement initiatives which span healthcare, manufacturing, aerospace and many other sectors where the quality of the end result is paramount.
Why are process maps useful?
They create a graphic representation of a process which is easy to understand, they help to identify parts of a process which lack consistency or where steps are omitted. If created with thought, they are easier to understand than wordy descriptions and can help us to mentally process complex workflows.
How do I get started?
Here is what you will need...
An idea of what you will map
The team who will be involved
Sticky notes and a wall
Pens or a whiteboard
The objective of a process map is to capture the activity as it actually occurs, or for a project in the planning stage, how you think it will occur. The majority of research is a team activity and the most crucial aspect of process mapping is to involve the entire team. It’s a fantastic way to build consensus, create a shared sense of ownership and bring diverse perspectives to your research.
Steps to create a process map
Choose a process which is fundamental to your research which involves a number of steps.
Pick a process which has a defined start and finish. If it is a complex process it is often wise to divide it into a smaller sub processes
Decide how you want to create your map. It's best to use a medium that you can change, which is why we like using sticky notes or a white board.
Assemble your team! Process mapping is a collaborative activity, it is best done with all relevant members of the team present, or at least represented. Ask them to bring all the instructions, SOPs and other documents they use when they conduct the process. Tip: this is probably the most important step of all.
Ask for a volunteer to write down the process as you go along.
Agree on the starting point for your purpose.
Draw a terminator (looks like a sausage) to denote the start.
Add processes in sequence, referring to all the written instructions you brought along.
Add arrows to each shape to show which direction to move. When there is a decision, add text, e.g. Yes/No
Refine the steps and the order as you move along, it's unlikely that you will get it right first time.
Ask everyone to step back and admire their work.
As a team, check is the map reflects the actual process used, if not, go back to step 9 to refine the steps, if yes, move to the next step.
Congratulate yourselves and take photos of the process so you have a record - keep the photos safe and when you are ready create a digital version using Canva, Draw.io, PowerPoint, etc.
At the end of the process put another terminator sausage in to mark it as complete.
And here is a process map of how to create a process map!

Which one do you prefer, the written list or the process map?
It’s not as easy as you might think to create step-by-step instructions. We will often omit steps, either in error or because we assume that everyone is familiar with a particular technique and so we don’t explicitly describe it.
CASE STUDY: A seemingly small procedural difference in the methods used by two different laboratories meant that they were unable to replicate each other’s fluorescence-activated cell sorting (FACS) profiles for primary breast cells (1). The issue causing the markedly different profiles was eventually identified to be the speed and length of an agitation step within a process which both labs performed routinely. It took over a year and some detailed analytical work to pinpoint this difference!
High quality information on methods, whether they relate to the generation or analysis of data, are a key element of reproducible and replicable research (2,3).
Process maps are more visually engagingt han text , but importantly, they can be used as process improvement tools in ways in which text cannot:
Process maps help to assess how logical a process is and identify steps which are missing
They can facilitate Team Science by bringing together all of the people who have a role in conducting research and facilitate a critique of all parts of a process
They can help to reveal redundant steps and unnecessary complexity
In our next blog we will look at how process maps can be used as quality improvement tools to identify elements of the process which are critical to the quality of the outputs. In the meantime, why not have a go at mapping a simple process?
1. Hines, C.H., Su, Y., Kuhn, I., Polyak, K., Bissell, M.J. Sorting Out the FACS: A Devil in the Details, Cell Reports, Volume 6, Issue 5, 13 March 2014, Pages 779-781 https://doi.org/10.1016/j.celrep.2014.02.021
2. Weissgerber, T.L., Gazda, M.A., Nilsonne, G. et al. Understanding the provenance and quality of methods is essential for responsible reuse of FAIR data. Nat Med (2024). https://doi.org/10.1038/s41591-024-02879-x
3. Baker, M. 1,500 scientists lift the lid on reproducibility. Nature 533, 452–454 (2016). https://doi.org/10.1038/533452a